Security Analysis Dashboard
View on GitHubDemo Walkthrough
This demo showcases the live SOC monitoring workflow including incident generation ingestion into Splunk and dashboard driven alert analysis.
</>Tools
Data Generation
- Python
- JSON Logs
- Event Simulation
SIEM
- Splunk
- Log Ingestion
- SPL
Analysis
- SOC Dashboards
- Severity Trends
- Incident Queues
The Security Analysis Dashboard project was built to simulate how Security Operations Centers collect ingest and visualize security telemetry in order to support alert triage and incident investigation workflows.
At the core of the project is a custom Python based incident generator designed to continuously produce realistic security alerts commonly observed in enterprise environments. Rather than relying on static datasets the generator creates structured incident tickets in real time including fields such as incident type severity affected assets exposure confidence and timestamps. Incident severity is dynamically calculated using a simple risk based scoring approach allowing events to be classified as Low Medium High or Critical based on multiple contributing factors.
To better reflect real SOC conditions the generator runs continuously and emits events at randomized intervals creating a live stream of security telemetry. Each incident is written as a JSON formatted log entry allowing the data to behave like operational telemetry generated by endpoint agents network sensors or detection tools.
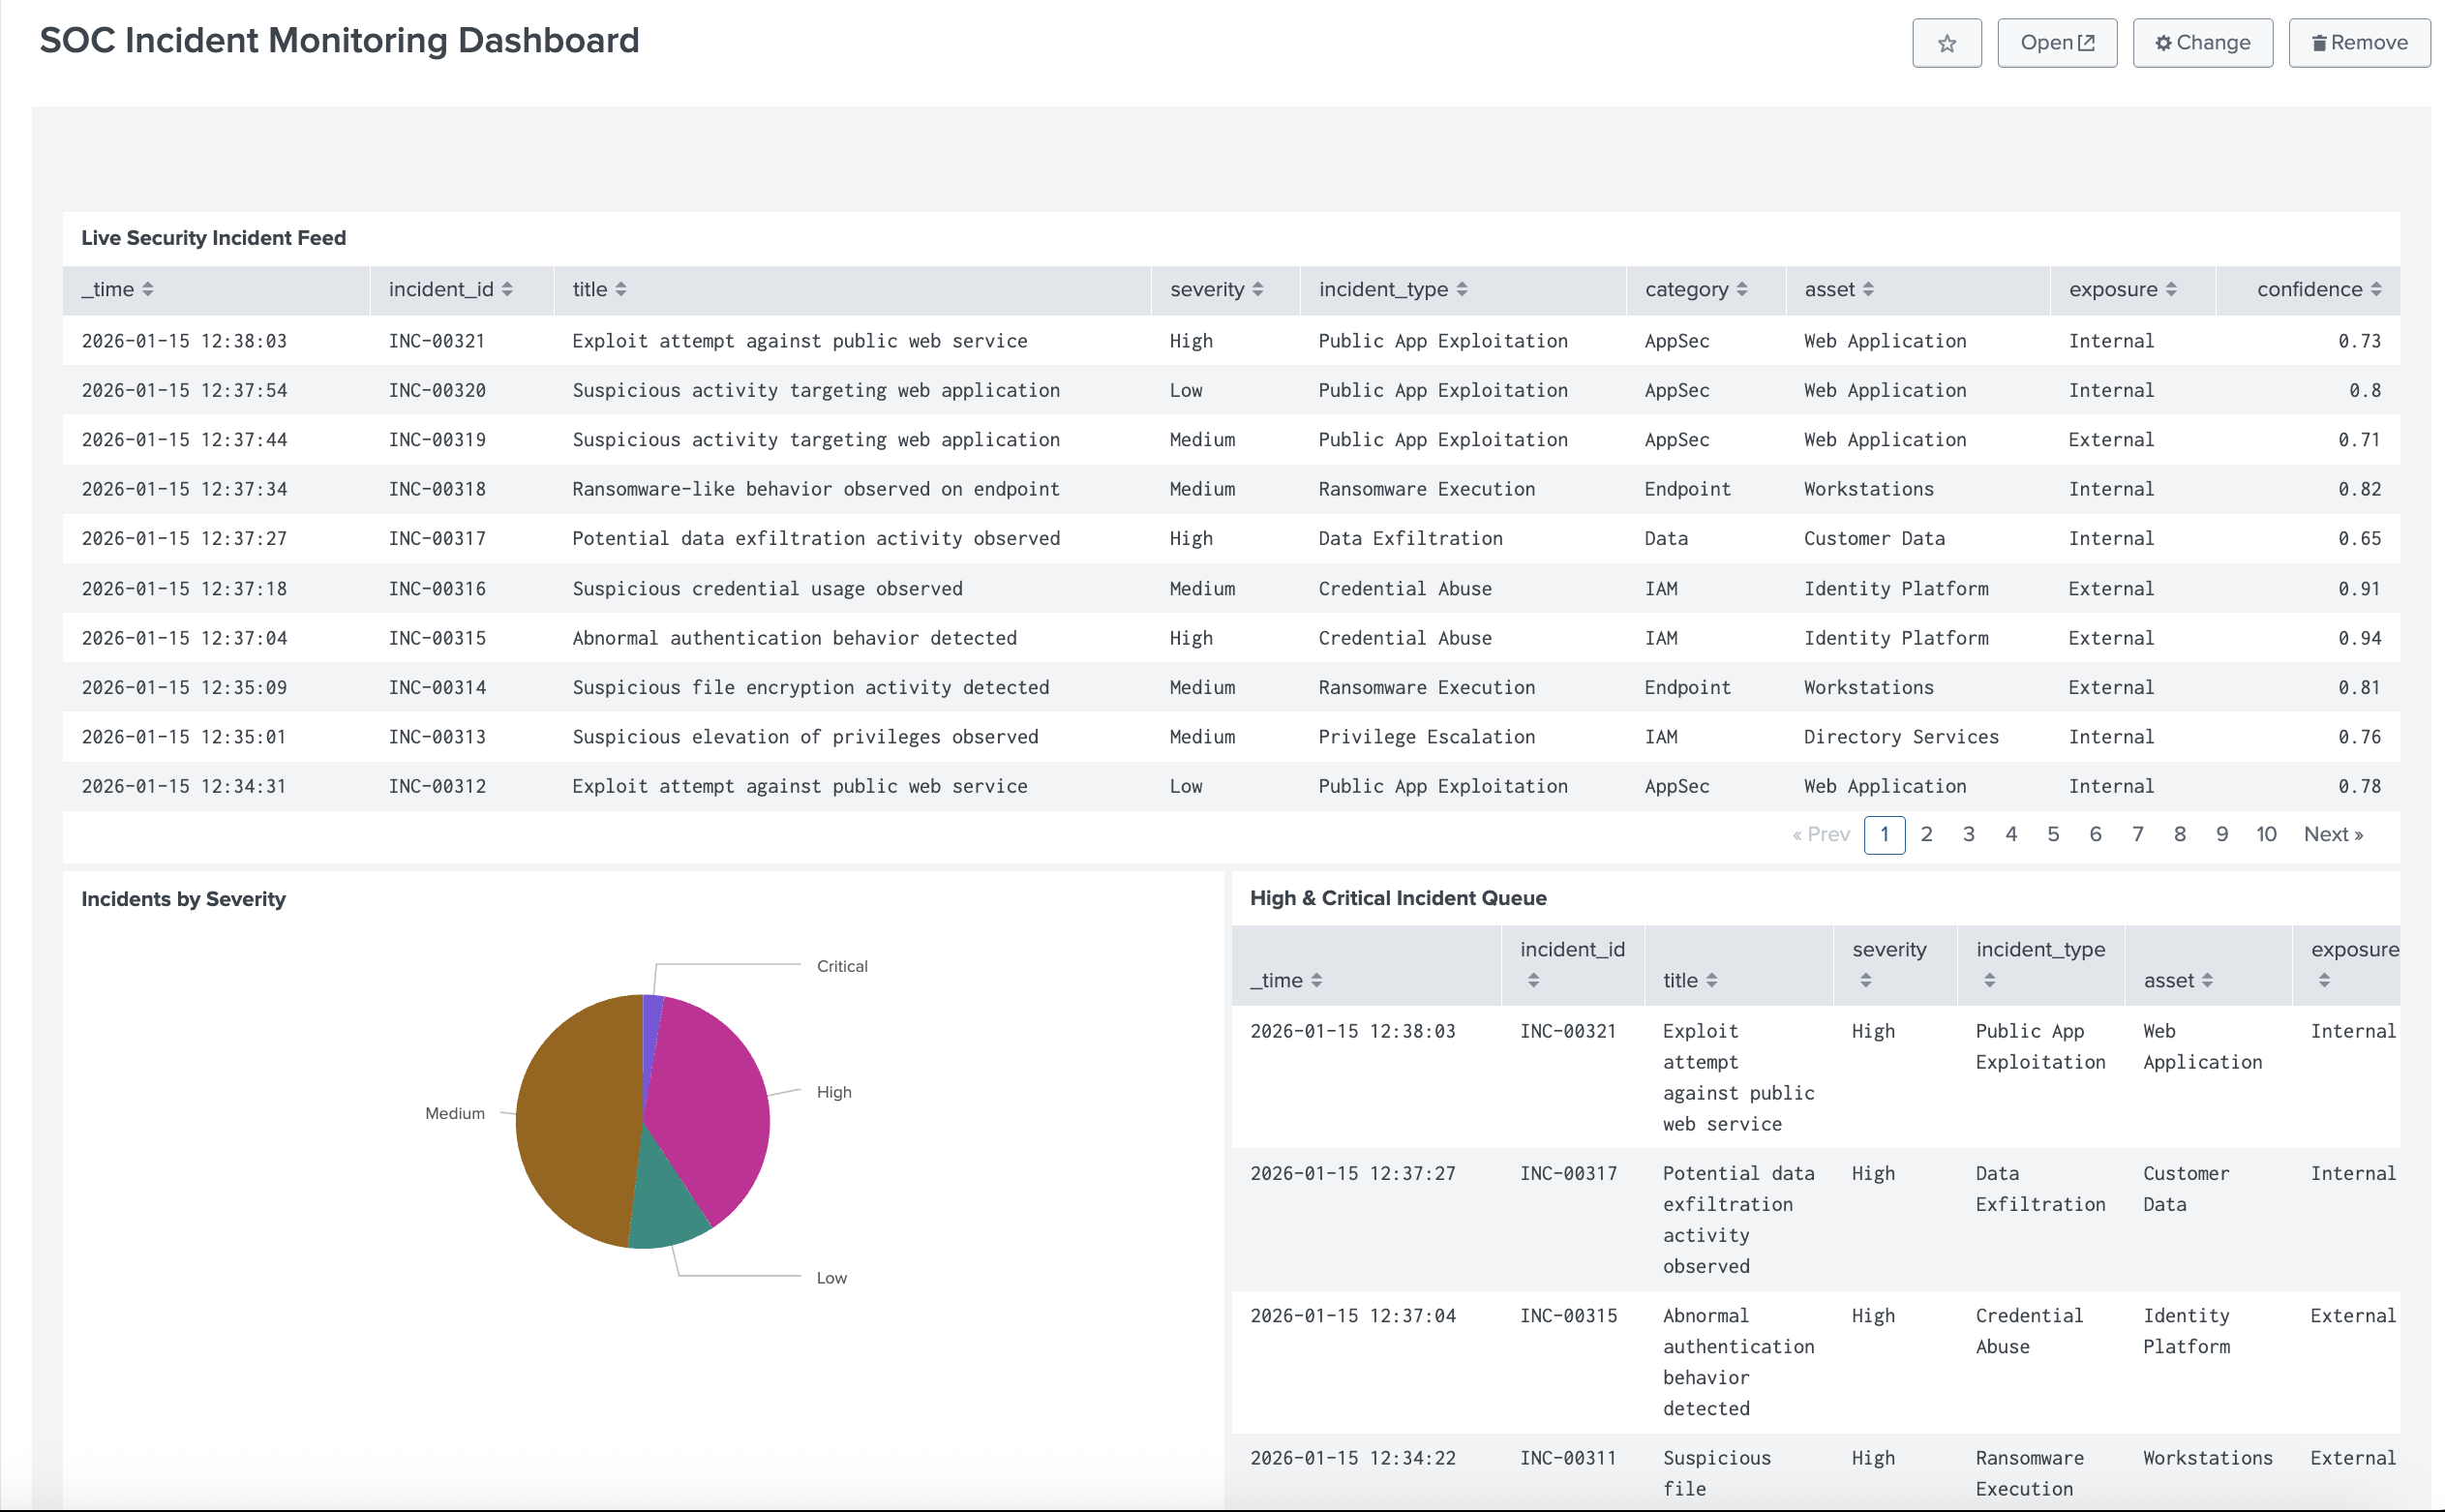
Live Splunk dashboard showing incident feed severity distribution and high priority incident queue
These generated incidents are ingested into Splunk using a standard log based ingestion process similar to how SOCs onboard new data sources. Once indexed the data can be searched correlated and aggregated to support downstream analysis and visualization.
On top of this telemetry SOC style Splunk dashboards were built to provide analysts with immediate situational awareness. The live incident feed displays incoming alerts while visualizations highlight severity distribution high priority incidents and affected assets. This allows analysts to quickly identify spikes in activity prioritize investigations and drill into individual alerts for deeper analysis.
Overall the project demonstrates a realistic end to end SOC monitoring workflow from incident generation and data ingestion to SIEM based visualization and analyst decision support.
SOC Takeaway
Effective SOC monitoring relies on reliable telemetry ingestion clear visualization and fast analyst context. This project demonstrates how dashboards transform raw alerts into actionable security insight.